
Supercomputing + 40 Years of Landsat Images = A New Era for Earth Science
Noticia publicada en Earth Observatory de la NASA
When Rebecca Moore received the formal notice in 2006 about a proposed forest thinning initiative, she nearly tossed it out. The letter included an unintelligible black-and-white topographic map of her central California community. It marked the location of the forest and the path that helicopters would take as they hauled logs off the steep hillsides.
Just before the proposal hit the trash, it captured her curiosity. “I wanted to understand what this map was saying, because I wanted to know if my community was threatened,” said Moore. “We have the largest remaining stand of old-growth redwood trees in Santa Clara County.”
A Google employee, Moore wondered how the map might look in the newly released Google Earth. When she looked at the forest thinning plan on the satellite-based map, it became clear that helicopters would be towing trees right over several high-traffic areas, including a school. That Google map helped persuade the community to stop the thinning initiative.
The experience got Moore thinking: Could Google Earth do more? Would it be possible to combine the satellite data behind Google Earth with the company’s powerful data-sorting algorithms and cloud computing?
“YouTube did a major machine learning (analysis) of the corpus of YouTube videos, and they found that there are a lot of cats,” Moore said. That analysis is just one example of a growing phenomenon known as “big data» in which computers crunch vast quantities of information to identify useful patterns. Moore thought: What patterns would emerge if you applied the big data approach to Earth imagery?
It’s a question that Earth scientists also have been asking. In 2008, the U.S. Geological Survey took 3.6 million images acquired by Landsat satellites and made them free and openly available on the Internet. Dating back to 1972, the images are detailed enough to show the impact of human decisions on the land, and they provide the longest continuous view of Earth’s landscape from space.
Since January 1, 2000, more than 4.3 million scenes have been captured by Landsat satellites and made available to the public. Landsat 8 was launched in February 2013, significantly boosting the rate to as many as 1,400 images each day. (Graph by Joshua Stevens, using data collected from the U.S. Geological Survey acquisitions archive.)
“With the full Landsat record available, we can finally look at really big problems, like the global carbon cycle,” said Jeff Masek, the Landsat 7 project scientist and a researcher at NASA’s Goddard Space Flight Center. Because carbon dioxide gas amplifies greenhouse warming, understanding how it moves into and out of the atmosphere through the carbon cycle is central to understanding Earth’s climate.
Forests store carbon, and the Landsat series of satellites offers the most consistent, detailed, and global means to measure changes in forest health—both natural and human-caused (such as deforestation). But to get a sense of how much carbon is entering the atmosphere from forests, scientists have to figure out how to sort through petabytes of data.
From Still-Lifes to Motion Pictures
Evan Brooks, a statistician turned forestry scientist at Virginia Tech University, began his expedition into the Landsat record with a single forest. In western Alabama, row after row of loblolly pine trees grow in tall straight lines. For the Westervelt Company, that forest is a crop. For Brooks, the forest is a proving ground for a new method of understanding Landsat measurements.
“In the past, if we wanted to look for change, we would find a cloud-free scene and then find another cloud-free scene from the same season in another year,” Brooks said. Before 2008, Earth scientists didn’t try anything more complex because Landsat data cost as much as $600 per scene. Once all of the Landsat data became available free of charge, the statistician in Brooks wondered if he could find a better way to identify change by using the entire record.
“I didn’t want to think about still-lifes anymore,” he said. “I am now treating each Landsat measurement like a frame in a movie. When you start seeing things moving through time, you get a deeper sense of what is happening. If a picture is worth a thousand words, then the movie is worth a thousand pictures.”
To build his movie of change in Westervelt’s forest, Brooks broke each Landsat scene into its smallest elements. Landsat satellites measure reflected and emitted light, both visible and infrared, for each 30-square-meter parcel of land on Earth. This area, about the size of a baseball diamond, makes up the smallest element of a Landsat image: a pixel.
Landsat 8 acquired these two images of forest clearing in northern Alabama. The satellite can readily spot landscape changes down to the size of a baseball diamond. (NASA Earth Observatory image by Joshua Stevens, using Landsat data from the U.S. Geological Survey)
 DESCARGAR NOTA DE PRENSA EN PDF
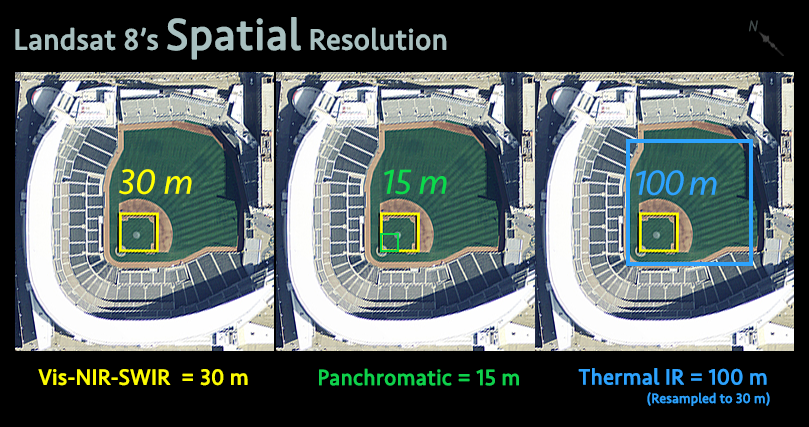